Tutorials
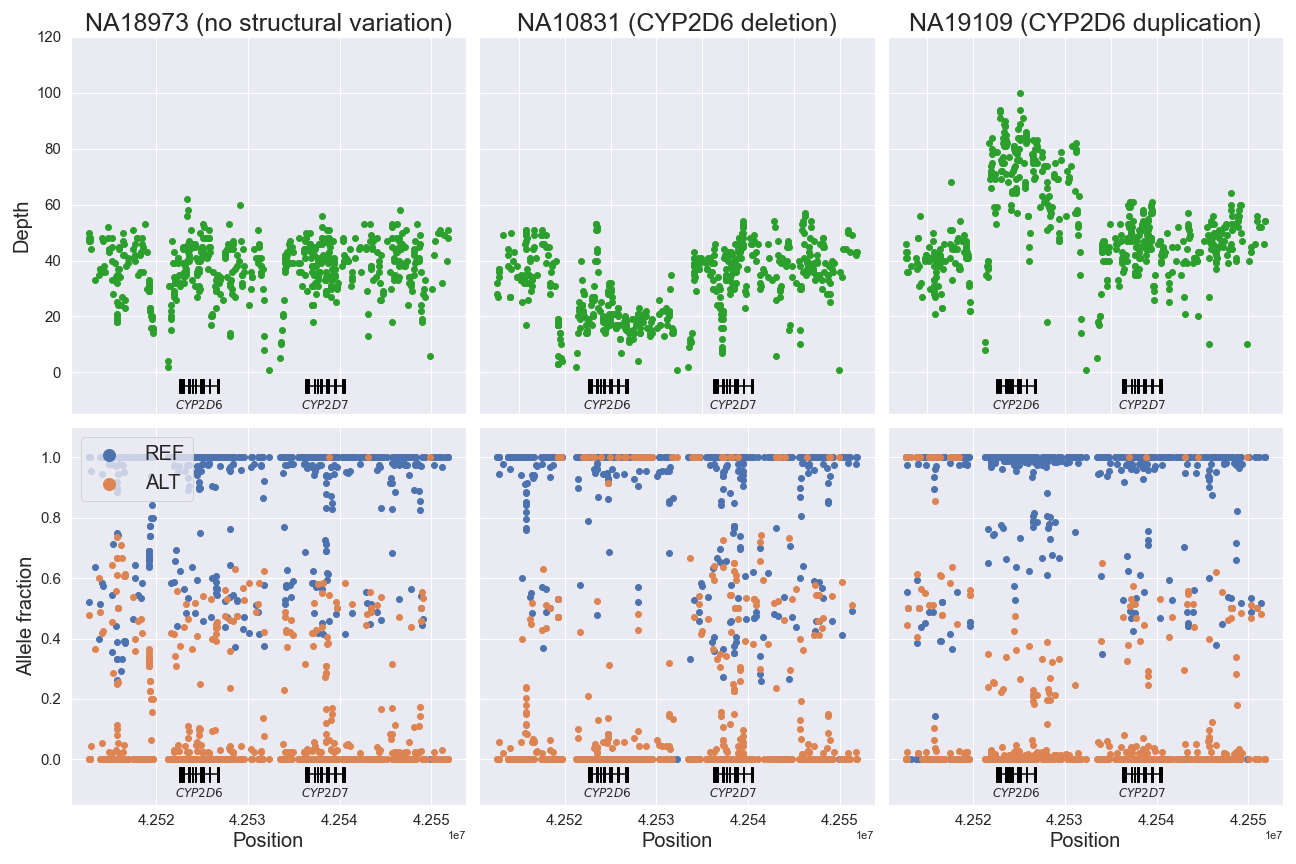
Visualization of structural variation with VCF
It is possible to visualize structural variation (SV) using VCF data (vcf_sv.py):
Create customized oncoplots
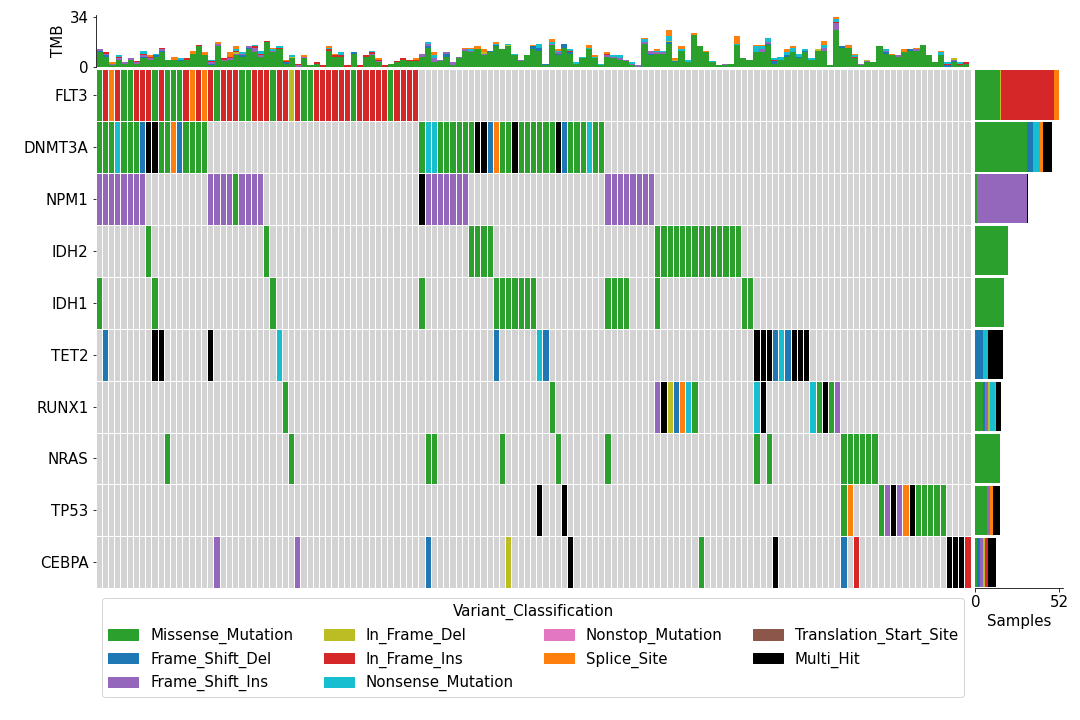
We can use either the maf_oncoplt command or the pymaf.plot_oncoplot() method to create a “standard” oncoplot like the one shown below.
While the plot is pleasing to the eye, one may wish to customize it to add, for example, various annotation data for the samples like this:
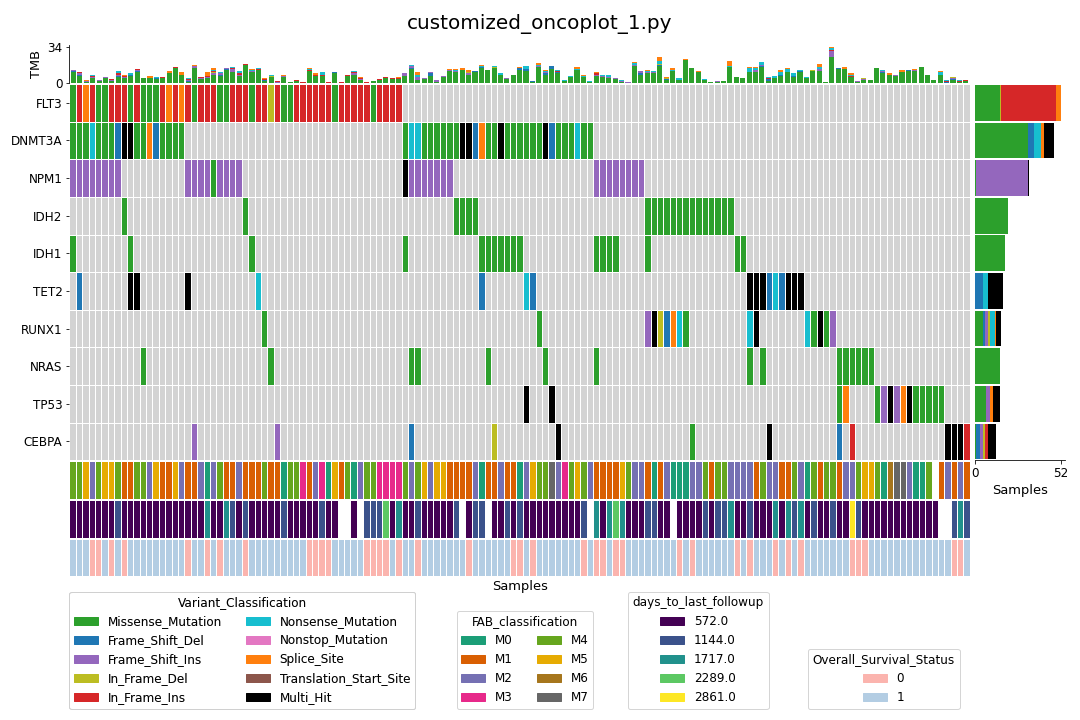
We can (relatively) easily achieve above thanks to the LEGO block-like plotting methods in the pymaf submodule (customized_oncoplot_1.py).
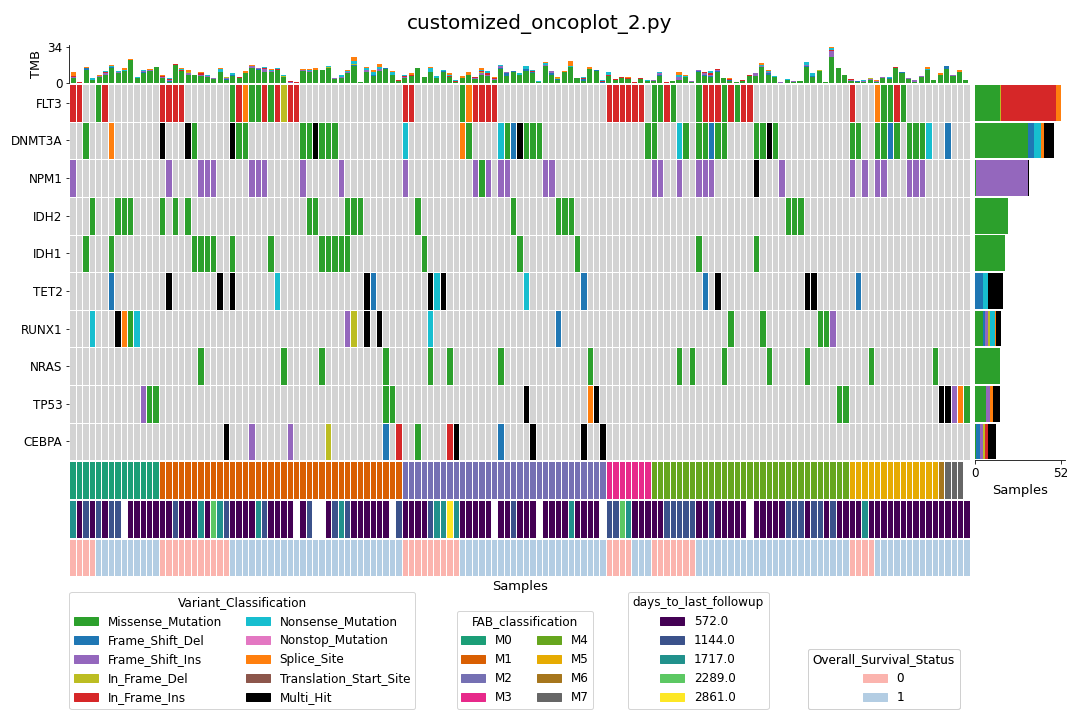
We can go one step further and sort the samples by one or more annotations (customized_oncoplot_2.py):
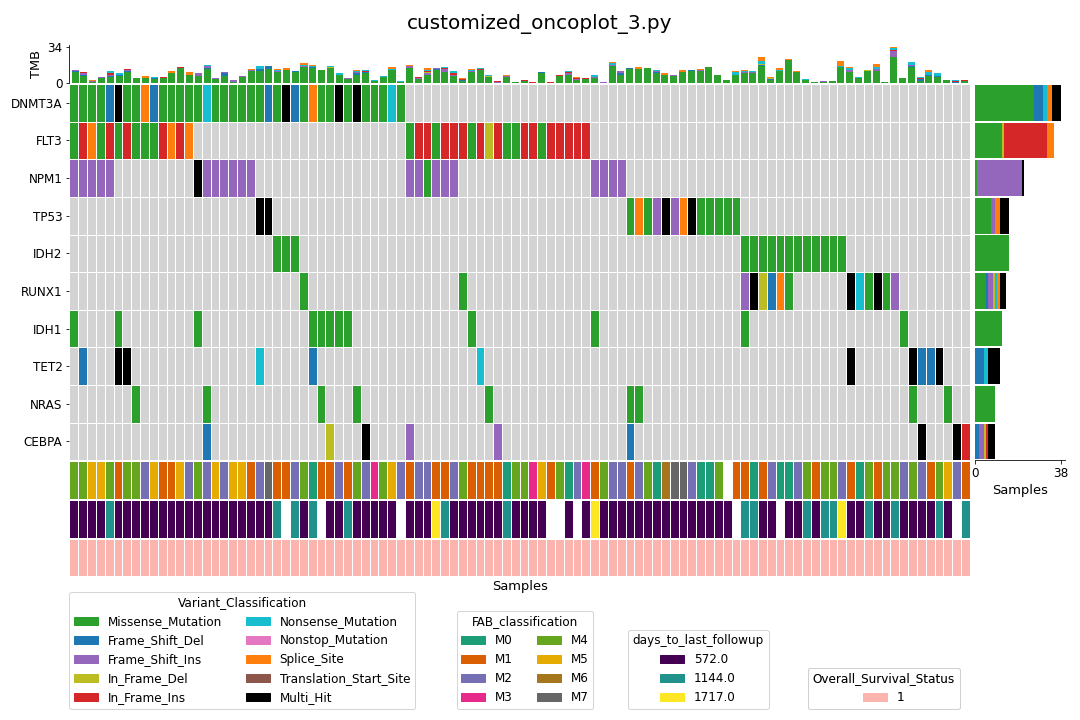
Finally, we can also subset the samples with annotation data (customized_oncoplot_3.py):
Control plot colors
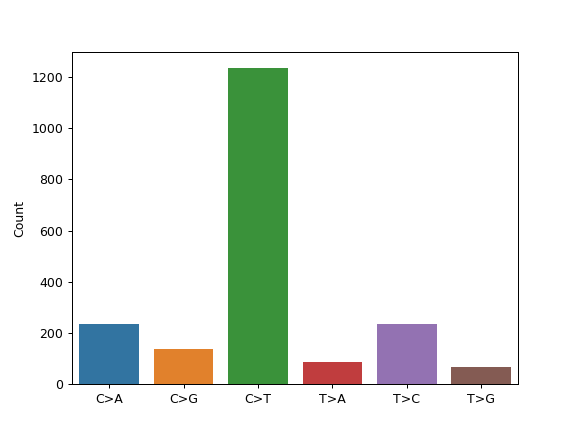
Let us consider the fuc.api.pymaf.MafFrame.plot_snvclsc() method as an example. The method internally uses seaborn.barplot() to draw bar plots.
from fuc import common, pymaf
common.load_dataset('tcga-laml')
maf_file = '~/fuc-data/tcga-laml/tcga_laml.maf.gz'
mf = pymaf.MafFrame.from_file(maf_file)
mf.plot_snvclsc()
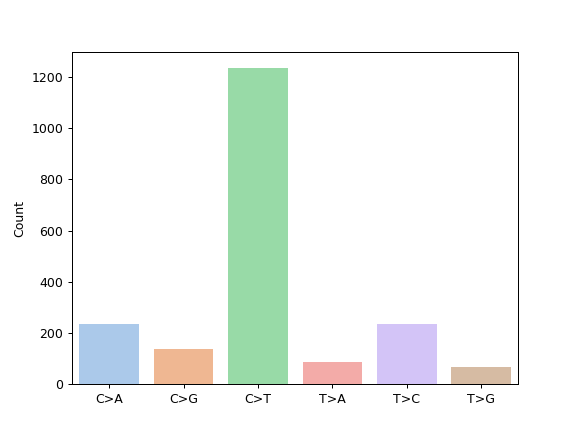
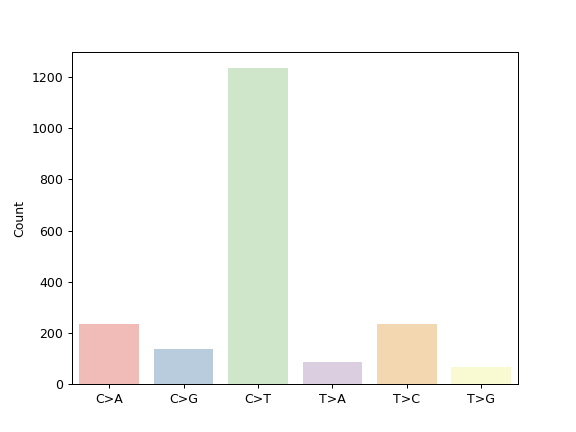
In order to change the colors according to one of the seaborn palettes (e.g. ‘deep’, ‘muted’, ‘pastel’), we can use the palette option:
import seaborn as sns
mf.plot_snvclsc(palette='pastel')
To choose one of the colormaps available in maplotlib (e.g. ‘tab10’, ‘Dark2’, ‘Pastel1’), we can use the palette option with seaborn.color_palette():
mf.plot_snvclsc(palette=sns.color_palette('Pastel1'))
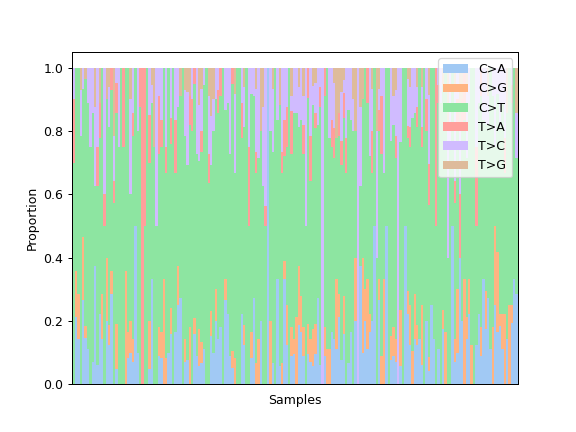
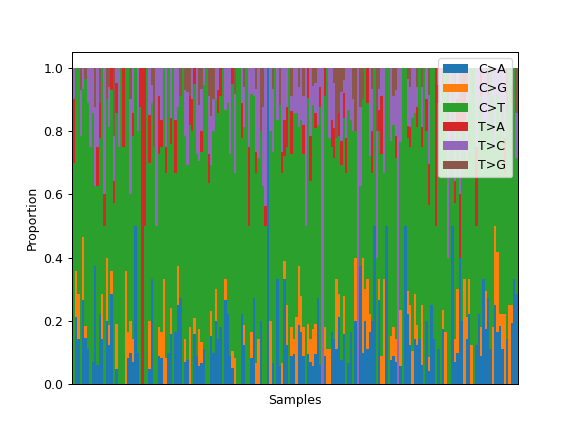
Some plotting methods use maplotlib instead of seaborn for coloring, like the fuc.api.pymaf.MafFrame.plot_snvclss() method:
ax = mf.plot_snvclss(width=1)
ax.legend(loc='upper right')
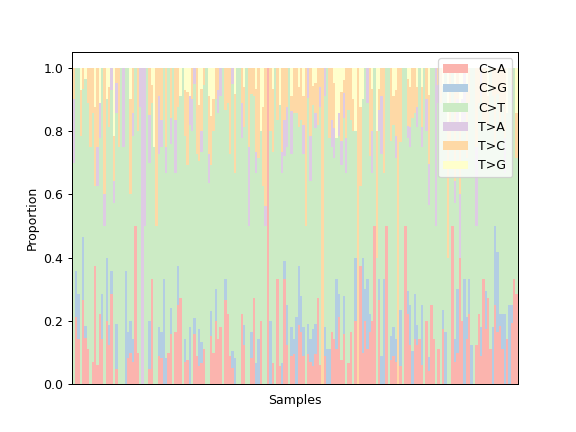
To choose a colormap from maplotlib:
import matplotlib.pyplot as plt
ax = mf.plot_snvclss(width=1, color=plt.get_cmap('Pastel1').colors)
ax.legend(loc='upper right')
To choose a palette from seaborn:
ax = mf.plot_snvclss(width=1, color=sns.color_palette('pastel'))
ax.legend(loc='upper right')